Survey shows how people decide what to trust online

Alex Mahadevan is director of MediaWise at the Poynter Institute. He has taught digital media literacy to thousands of middle and high schoolers, and has trained hundreds of journalists from around the world in verification and digital investigative tools. We caught up with Alex to find out about a recent information literacy survey his organization conducted in partnership with YouGov, with support from Google. Learn more about how Google is working on information literacy and helping you spot misinformation online.
Why was this survey conducted?
Misinformation isn’t a new problem, but it’s becoming increasingly difficult to separate fact from fiction, especially on the internet. We wanted to learn more about how people across generational lines verify information and decide what to trust and share online. And we knew this research would help us expand on the educational resources MediaWise has to offer.
What were the parameters for the survey?
We surveyed more than 8,500 respondents of various ages in the United States, Brazil, the United Kingdom, Germany, Nigeria, India and Japan. We asked a wide range of questions aimed at assessing information literacy skills and verification habits. Those include queries about everything from the tools and techniques someone uses to investigate a post they see online, to the reasons why they may have shared misleading information in the past.
What are some of the biggest takeaways?
The survey found that 62% of respondents think they see false or misleading information on at least a weekly basis – that’s a staggering number. And people are aware that it’s a serious issue. Roughly 50% of all Gen X, Millennial and Gen Z respondents (these are people ages 18 to 57) said they’re concerned about their family being exposed to it.
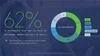
Sixty-two percent of respondents think they see false or misleading information daily or weekly.
What did the survey tell you about how people cross-check information they find online?
Gen Zers are two times more likely than the Silent Generation (people 68 or older) to use a search engine to verify information, and also two times more likely than Baby Boomers to check social media comments to verify something they’ve seen online. They’re also more likely to use advanced search techniques, like reverse image search, or to engage in lateral reading – that’s when you open multiple tabs and perform multiple searches at once — an effective technique studied by the Stanford History Education Group.
We also learned that, when deciding if something they’ve heard or read about is true, respondents across all generations agree that the most important thing is whether conclusions are supported by sources or facts. That was important for us to see: Facts matter.
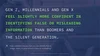
Gen Z, Millennials and Gen X feel slightly more confident in identifying false or misleading information than boomers and the Silent Generation.
Any final thoughts?
Our findings underscore how important it is to be able to trust the information you find online, and how taking the time to check multiple sources to verify what you see or to use resources like Google Search can be helpful in making sense of a complicated digital landscape. That’s why we’re working together to educate people about information literacy. We have a long running partnership with the Google News Initiative, which has provided support for projects like Find Facts Fast – our free microlearning course which anyone can take via text message or WhatsApp to improve their digital media literacy skills — and the Spanish version, MediaWise en Español.
Today we are also announcing a new partnership with Google, Poynter Institute for Media Studies, MediaWise and PBS NewsHour’s Student Reporting Labs to develop weekly information literacy lesson plans for teachers of middle and high school students across the U.S. The lesson plans will be available for free to teachers using PBS LearningMedia and for download on Poynter’s website. We’re excited to build on our partnership to give people the skills they need to recognize misinformation when they see it and help stop its spread.